Monitoring
With thin-edge.io device monitoring, you can collect metrics from your device and forward these device metrics to IoT platforms in the cloud.
Using these metrics, you can monitor the health of devices and can proactively initiate actions in case the device seems to malfunction. Additionally, the metrics can be used to help the customer troubleshoot when problems with the device are reported.
thin-edge.io uses the open source component collectd to collect the metrics from the device.
thin-edge.io translates the collectd metrics from their native format to the thin-edge.io JSON format
and then into the cloud-vendor specific format.
Install
Device monitoring is not enabled by default, however it can be enabled using a community package, tedge-collectd-setup, which will install collectd and configure some sensible defaults including monitoring of cpu, memory and disk metrics.
- Debian/Ubuntu
- RHEL/Fedora/RockyLinux
- Alpine
sudo apt-get install tedge-collectd-setup
sudo dnf install tedge-collectd-setup
sudo apk add tedge-collectd-setup
The default collectd settings, /etc/collectd/collectd.conf, use conservative interval times, e.g. 10 mins to 1 hour depending on the metric. This is done so that the metrics don't consume unnecessary IoT resources both on the device and in the cloud. If you want to push the metrics more frequently then you will have to adjust the Interval settings either globally or on the individual plugins. Make sure you restart the collectd service after making any changes to the configuration.
Background
The following sections provide information about further customizing the collectd settings and give some background about how the collectd messages are processed by the tedge-mapper-collectd service.
collectd configuration
You can further customize the default collectd configuration by editing the following file:
/etc/collectd/collectd.conf
Details about collectd plugins and their configuration can be viewed directly from the collectd documentation.
However keep in mind the following points when editing the file:
- MQTT must be enabled.
-
thin-edge.io expects the
collectdmetrics to be published on the local MQTT bus. Hence, you must enable the MQTT write plugin of collectd. -
The MQTT plugin is available on most distribution of
collectd, but this is not the case on MacOS using homebrew. If you are missing the MQTT plugin, please recompilecollectdto include the MQTT plugin. See https://github.com/collectd/collectd for details. -
Here is a config snippet to configure the MQTT write plugin:
 LoadPlugin mqtt

 <Plugin mqtt>
     <Publish "tedge">
         Host "localhost"
         Port 1883
         ClientId "tedge-collectd"
     </Publish>
 </Plugin>
-
- RRDTool and CSV might be disabled
-
The risk with these plugins is to run out of disk space on a small device.
-
With thin-edge.io the metrics collected by
collectdare forwarded to the cloud, hence it makes sense to disable Local storage. -
For that, simply comment out these two plugins:
#LoadPlugin rrdtool
#LoadPlugin csv
-
- Cherry-pick the collected metrics
-
Collectdcan collect a lot of detailed metrics, and it doesn't always make sense to forward all these data to the cloud. -
Here is a config snippet that uses the
match_regexplugin to select the metrics of interest, filtering out every metric emitted by the memory plugin other than the used metric":PreCacheChain "PreCache"
LoadPlugin match_regex
<Chain "PreCache">
<Rule "memory_free_only">
<Match "regex">
Plugin "memory"
</Match>
<Match "regex">
TypeInstance "used"
Invert true
</Match>
Target "stop"
</Rule>
</Chain>
-
tedge-mapper-collectd
The tedge-mapper-collectd service subscribes to the collectd/# topics to read the monitoring metrics published by collectd
and emits the translated measurements in thin-edge.io JSON format to the measurements topic.
The metrics collected by collectd are emitted to subtopics named after the collectd plugin and the metric name. You can inspect the collectd messages using the following commands:
- tedge
- mosquitto
- mqtt
tedge mqtt sub 'collectd/#'
mosquitto_sub -t 'collectd/#'
collectd/#
[collectd/raspberrypi/cpu/percent-active] 1623076679.154:0.50125313283208
[collectd/raspberrypi/memory/percent-used] 1623076679.159:1.10760866126707
[collectd/raspberrypi/cpu/percent-active] 1623076680.154:0
[collectd/raspberrypi/df-root/percent_bytes-used] 1623076680.158:71.3109359741211
[collectd/raspberrypi/memory/percent-used] 1623076680.159:1.10760866126707
The tedge-mapper-collectd translates these collectd metrics into the thin-edge.io JSON format,
grouping the measurements emitted by each plugin:
- tedge
- mosquitto
- mqtt
tedge mqtt sub 'te/+/+/+/+/m/+'
mosquitto_sub -t 'te/+/+/+/+/m/+'
te/+/+/+/+/m/+
[te/device/main///m/] {"time":"2021-06-07T15:38:59.154895598+01:00","cpu":{"percent-active":0.50251256281407},"memory":{"percent-used":1.11893578135189}}
[te/device/main///m/] {"time":"2021-06-07T15:39:00.154967388+01:00","cpu":{"percent-active":0},"df-root":{"percent_bytes-used":71.3110656738281},"memory":{"percent-used":1.12107875001658}}
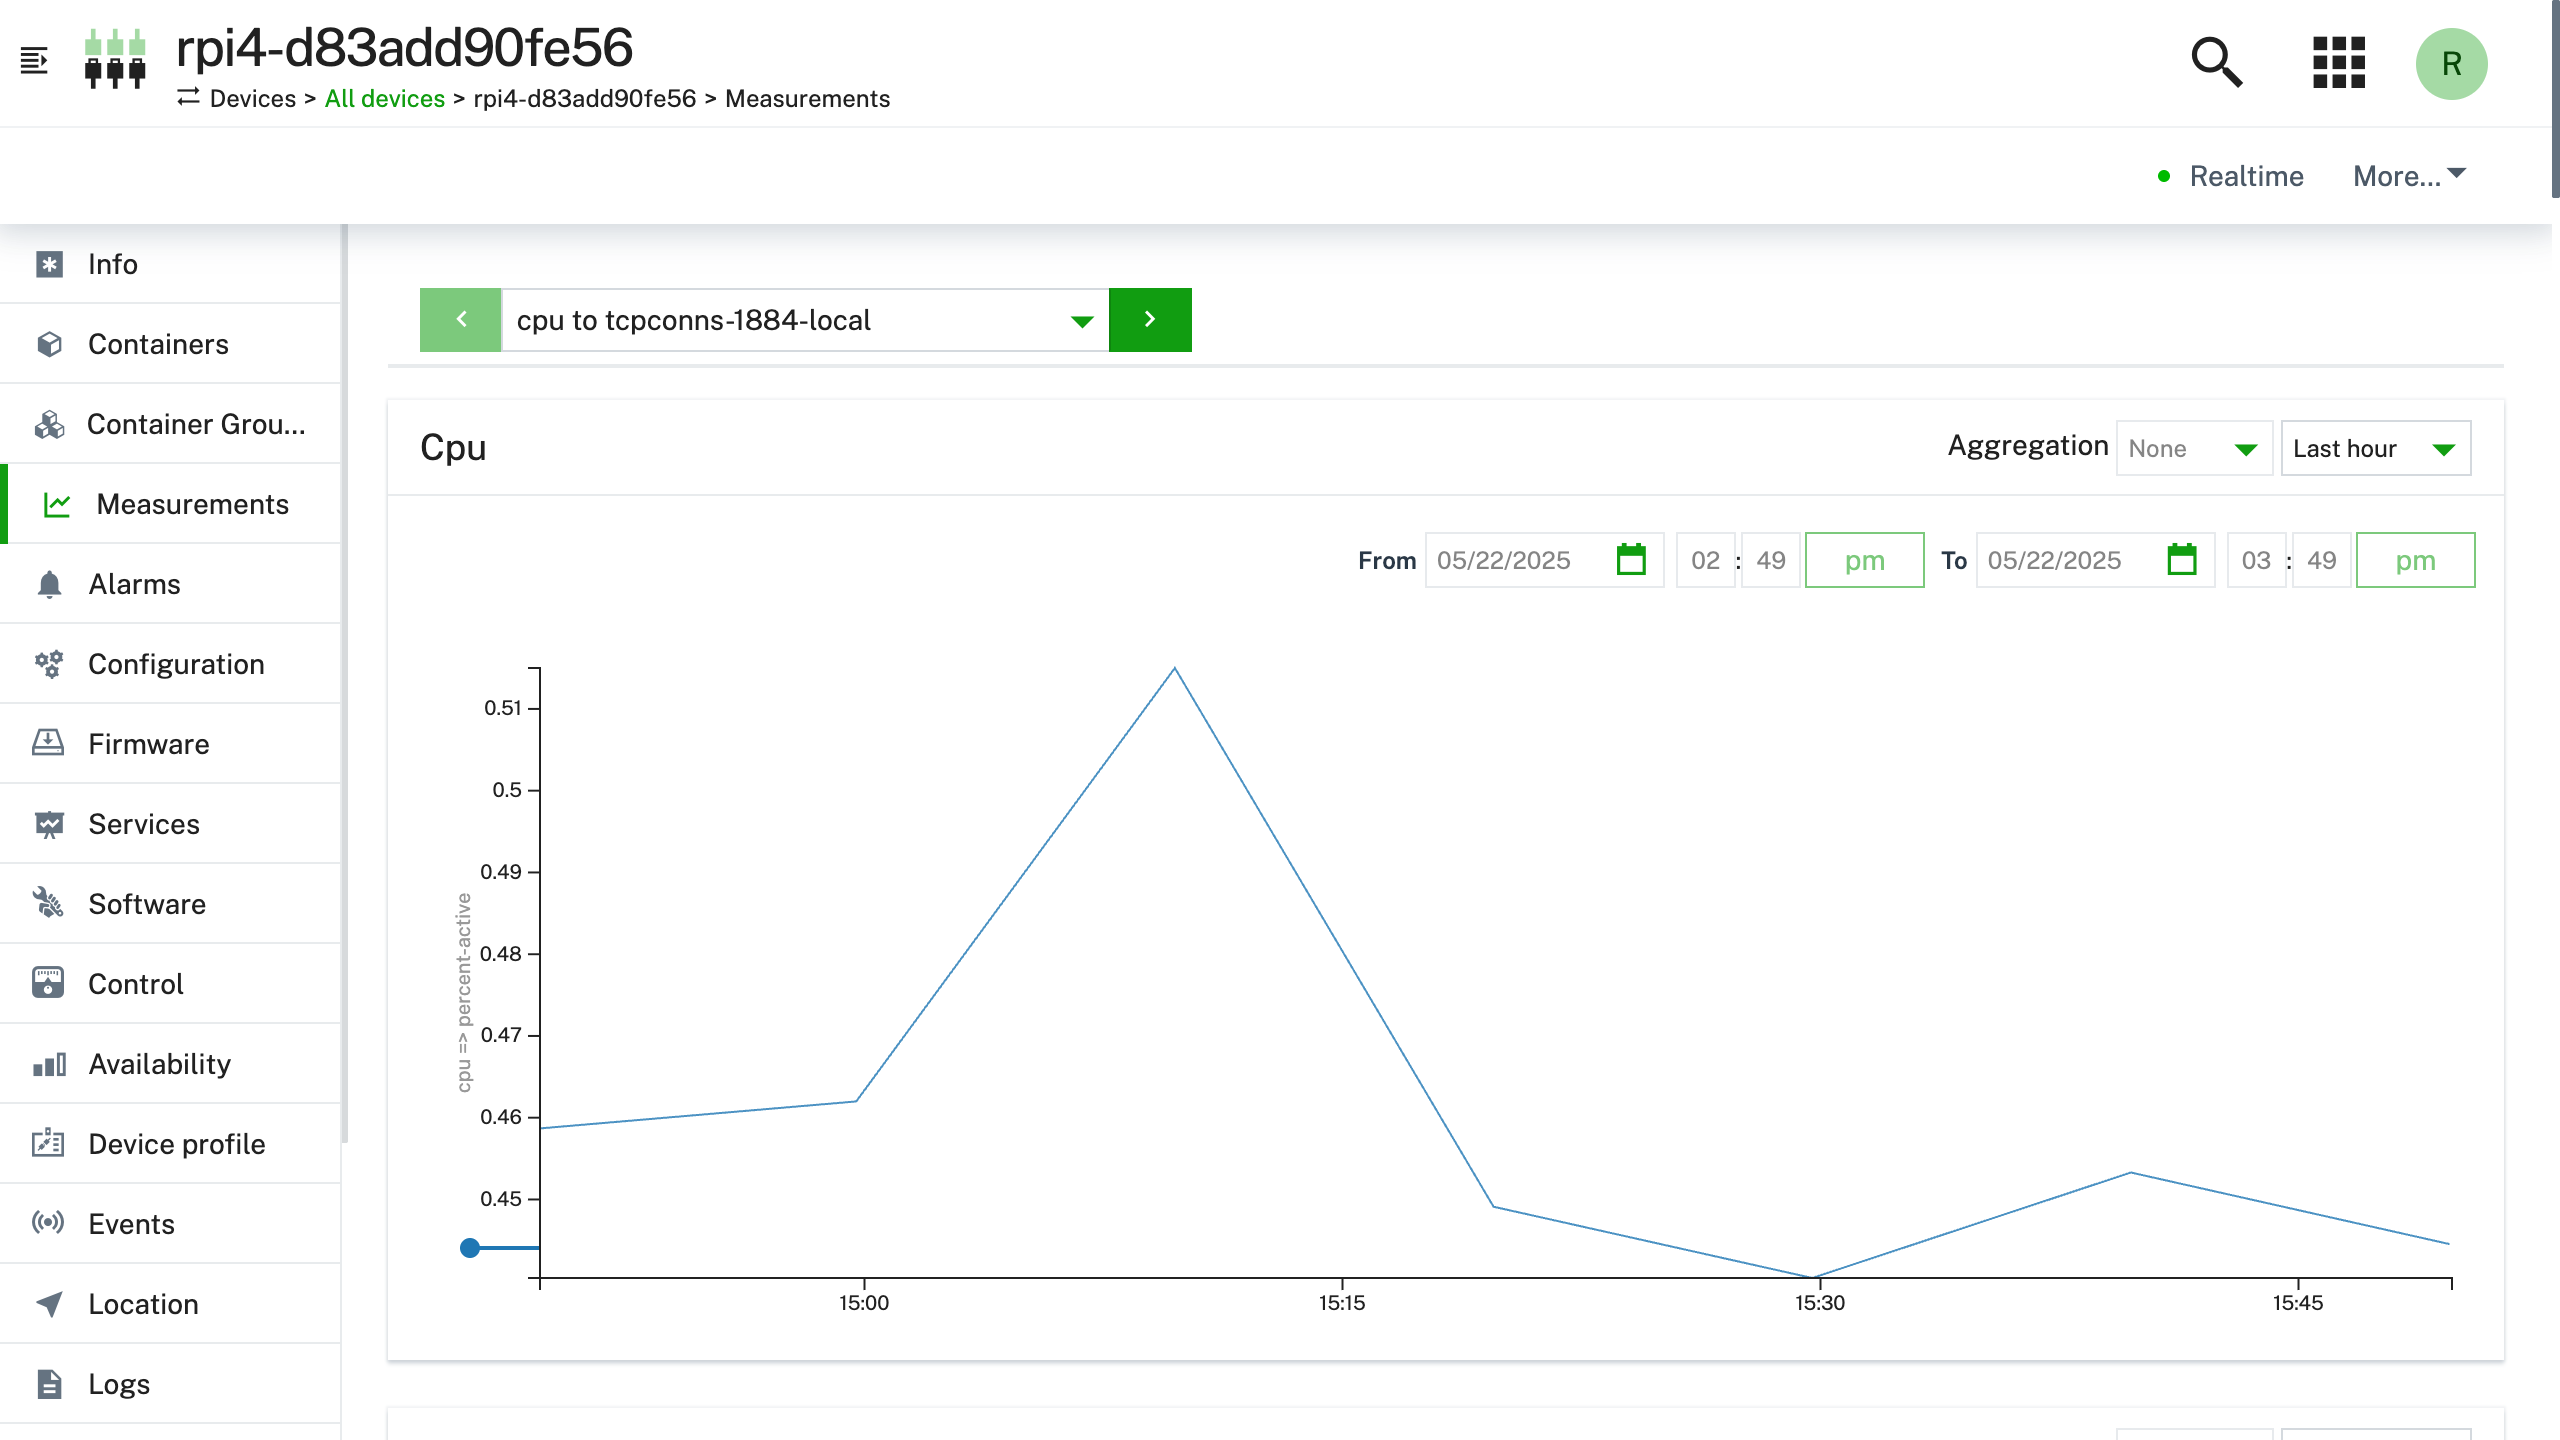
From there, if the device is actually connected to a cloud platform like Cumulocity, these monitoring metrics will be forwarded to the cloud.
- tedge
- mosquitto
- mqtt
tedge mqtt sub 'c8y/#'
mosquitto_sub -t 'c8y/#'
c8y/#
[c8y/measurement/measurements/create] {"type": "ThinEdgeMeasurement","time":"2021-06-07T15:40:30.155037451+01:00","cpu":{"percent-active": {"value": 0.753768844221106}},"memory":{"percent-used": {"value": 1.16587699972141}},"df-root":{"percent_bytes-used": {"value": 71.3117904663086}}}
[c8y/measurement/measurements/create] {"type": "ThinEdgeMeasurement","time":"2021-06-07T15:40:31.154898577+01:00","cpu":{"percent-active": {"value": 0.5}},"memory":{"percent-used": {"value": 1.16608109197519}}}
Troubleshooting
For troubleshooting tips, check out the device monitoring section.